Over a decade optimizing healthcare call centers, your staff follow the right clinical pathway every time, with protocols that match your specialty.


Fragmented systems create:
More work
Restarts
Care Delays
That’s not a staffing failure. It’s a systems problem.
We capture the full story once, then carry it forward to completion.
Repetitive work runs automatically, while complex cases finish with a warm handoff and full context.

Answers & completes routine calls 24/7
Resolves SMS/chat requests without wait
Guides patients on your site/portal.
Seamless handoffs
Guides Agents and Nurses in CareDesk with best actions
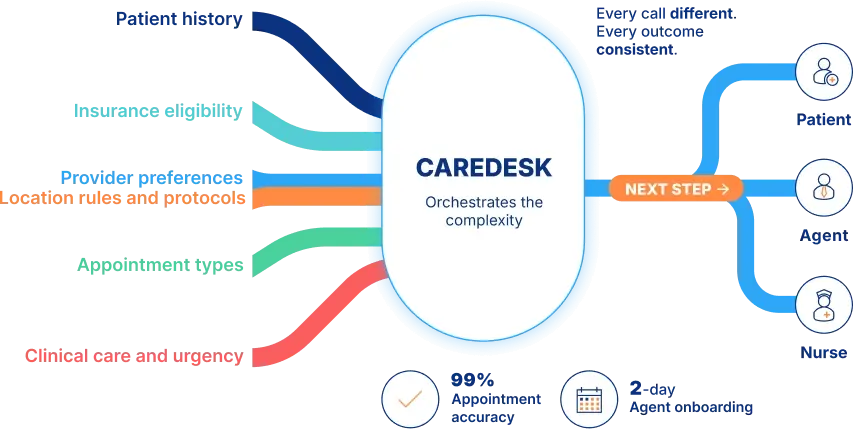
CareDesk ties channels together with Practice Intelligence 360, so work flows without fragmenting. Handoffs are seamless.
More requests turn into completed appointments, not voicemails, callbacks, or abandoned calls.
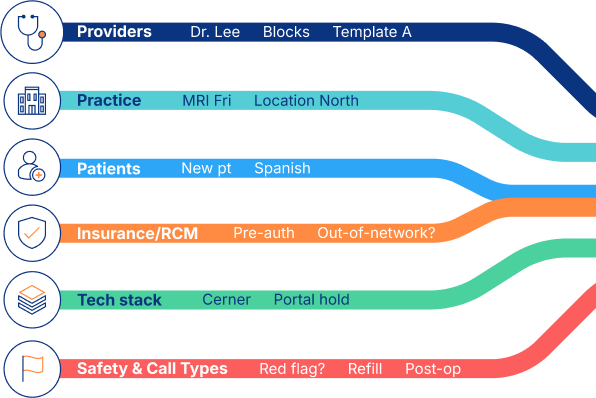
Clinical complexity is why agent training takes 6 weeks.
For over a decade, we’ve honed Practice Intelligence 360 to simplify your complexity:
for agents
for patients
with traceable logic
Appointments are scheduled correctly the first time, with your rules enforced automatically.
Most AI drifts. Ours doesn’t.
Deterministic practice intelligence powered by 3 layers of healthcare context:
What this means for you:
Staff trained in days… not weeks
Patients self-serve guided by YOUR rules
99% appointment accuracy with practically zero booking errors
13 years of healthcare operations locked in. Zero drift. Zero retraining. Zero surprises.
Every interaction captured. Every clinical decision supported. One system of record. Phone, web, and EHR data stay in sync so patients never restart and staff never search.


System of Record, Not Sidecar : One platform. All patient touchpoints. Full context
Clinical Safety You Can Audit : Every decision traceable. Zero black boxes.
Your Rules, Your Way : Configurable no-code admin. Update workflows in minutes
Real-time Intelligence : Across Systems. Sub-second sync. Current data. Better decisions.