HEALTHCARE OVERWATCH & BUSINESS INTELLIGENCE (BI)
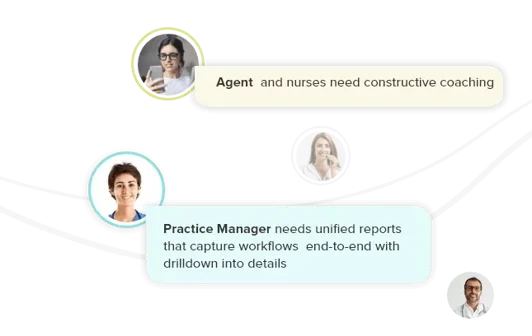
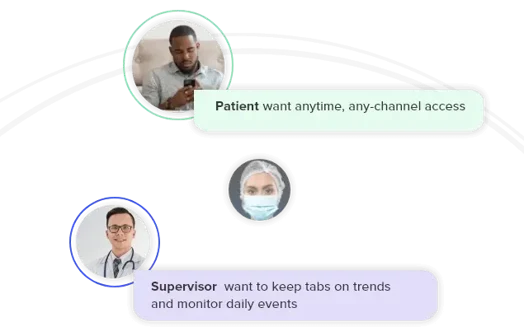
Equip your supervisors with superpowered insights! No matter where your remote staff is, your contact-center or call-center supervisors can be equipped with unparalleled insights into current health queues, call handle times, personalized dashboards & so much more. All they require to easily manage & coach remote telehealth staff.
Need real-time, up-to-date statistics? Want to track daily & hourly trends? How about the ability to drill-down into any queue to see each call, happening now? Want to message staff & coach them through issues, in real time? Welcome to Keona's Overwatch.


Overwatch gives an at-a-glance insight into how every telehealth queue is performing - with drill-down insights into individual agent & call. Supervisors can easily identify at-risk queues & assign shuffle patient-queues and staff accordingly. The Overwatch dashboards can be setup to follow your unique telehealth workflow, custom-tailored for for each client, roles, team, or group. Overwatch users are able to quickly initiate communication with any user, wherever they are and provide assistance. Q&A has never been so easy!

Communication channels each have their own unique statistics. Telephone, fax, paging and chat systems are typically siloed away from the bigger picture. To be blunt, useless. Fortunately, CareDesk's Overwatch isn't typical. Your system metrics can be logically-placed into a larger perspective, so you can easily analyze different communication channels.
Are you wanting to easily determine true patient satisfaction metrics like first contact resolution & time to resolution? Want to see how many emergent cases resulted in users paging a physician at your office? Deep-diving investigation requires you to link time-statistics with messaging-statistics (like paging), and correlate these to encounter statistics such disposition, outcome, provider or practically any metric, on demand? Correlate to your heart's desire! Obstacle free. Holistically.

Dice up agent/handler performance stats across all calls, shift, role, or function. See how any one user’s performance differs from their group, and use the insights to coach each individual user and improve group performance. Simple insights lead to great bottom-line shifts.

Build the reports you need without a line of code. Our visual report creator lets operations & business analysts build reports without contacting your IT department. Want to share the reports you just created? If you have the correct permissions, you can publish reports across different mediums without paying for any additional license.
Feel free to send us a message.
