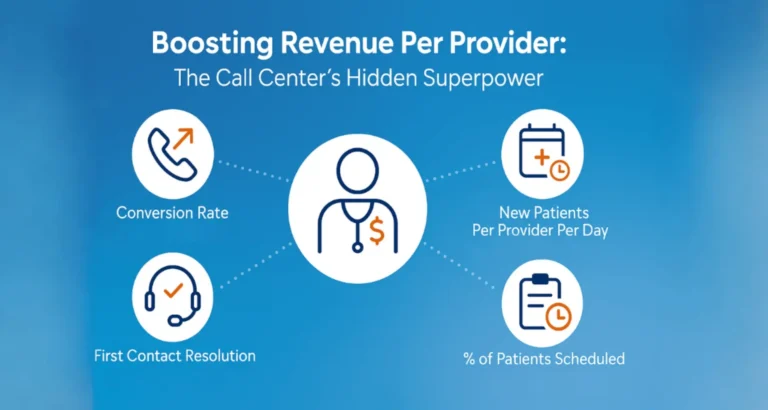


Devon had one job: figure out why patients weren’t coming back. He found himself staring at yet another spreadsheet of satisfaction scores. The numbers blurred together like highway lines on a rainy night. Despite mountains of metrics, Devon couldn’t see the forest for the trees. “I have all this data,” he told his leadership team, “but I still can’t tell you why patients aren’t coming back.”
Devon’s situation is not unusual. Most healthcare call centers collect more data than they know what to do with. The challenge isn’t access to information. It’s knowing which metrics actually explain patient loyalty, staff performance, and sustainable growth.
See how CareDesk turns your metrics into action. Book your demo today
How the Right Metrics Give Your Call Center a Clearer Direction
Here’s a sobering reality: 81% of healthcare executives say patient experience is a top priority, yet only 11% report a clear understanding of patient retention drivers. The map exists. The compass is missing.
Many organizations still rely almost exclusively on annual HCAHPS surveys and surface-level call metrics as their patient experience benchmarks. Those tools have value, but they don’t tell the full story.
Consider Miguel, a patient who called his provider three times to resolve a prescription issue. His survey asked only whether his call was answered promptly. By that measure, his experience was excellent. By every other measure, it wasn’t. Miguel needed his problem solved on the first call, not just his call answered.
Three Shifts in Measurement That Unlock Deeper Patient Insight
Shift 1: Moving Beyond Annual Surveys to Continuous Listening
Relying solely on HCAHPS surveys to understand patient satisfaction is a bit like guessing what your spouse wants for your anniversary based on last year’s comments. They offer a limited snapshot from a limited sample. The 2023 Healthcare Experience Trends Report by Qualtrics found that personal connection, not just operational efficiency, drives loyalty. Two-thirds of consumers (63%) believe organizations need to do a better job of listening. Building more frequent feedback loops gives your team the signal strength to act before patients leave.
Shift 2: Pairing Volume Metrics with Patient Experience Indicators
Call volume and missed calls (abandonment rate) are useful starting points, but they tell you what happened, not how your patients felt about it. Pairing these with patient sentiment, effort scores, and resolution outcomes gives your team a fuller picture of every interaction. As CHAUSA notes, practices with stronger communication processes directly improve both patient safety and satisfaction. Better metrics help you measure and reinforce those workflows.
Shift 3: Raising the Bar from Compliance to Patient-Centered Excellence
There is a meaningful difference between a hotel that passes inspection and one that makes you want to return. When you move beyond minimum service standards and focus on truly effortless, personalized care, you earn lasting patient loyalty. A McKinsey study found that 70% of patient experience outcomes are shaped by how patients feel they are being treated, not just whether their requests were technically fulfilled.
The Right Framework: Measuring What Actually Inspires Patient Loyalty
Three months after overhauling his team’s measurement approach, Devon walked into his morning meeting with something he hadn’t had before: clarity. “Patients who require multiple calls to resolve a single issue are far more likely to switch providers within six months,” he told his team. “Since we improved first call resolution by 30%, retention is up 12%.”
That kind of transformation starts with tracking the right metrics across your full patient access journey.
Below are the 15 metrics your healthcare call center should be actively monitoring, organized by category.
| Metric Name | Why It Matters |
|---|---|
| Net Promoter Score (NPS) | Measures patient loyalty and likelihood to recommend your practice |
| New Patients Scheduled Per Week or Month | Tracks whether your access experience is driving growth |
| Customer Effort Score (CES) | Reveals how easy or hard it is for patients to get help |
| Revenue Growth | Connects patient experience investments to financial performance |
| Unique Patients Per Month | Shows whether patients are returning and your practice is growing |
| First Contact Resolution (FCR) | Measures how often patient issues are resolved on the very first call |
| Time to Resolve | Tracks the full window from first contact to complete resolution |
| Employee Satisfaction | Reflects staff engagement, which directly shapes patient experience |
| Conversion Rate | Shows how many new patient calls become scheduled appointments |
| Quality Scores | Evaluates whether agents are genuinely helping patients, not just following scripts |
| Average Speed of Answer (ASA) | Measures how long patients wait before reaching a live agent |
| Abandonment Rate | Captures how many patients gave up before getting help |
| Service Level | Tracks whether calls are answered within your defined time threshold |
| Average Handle Time (AHT) | Measures total call time, including post-call work |
| Adherence Rate | Monitors whether agents are available when patients actually need them |
15 Patient Experience Metrics Your Healthcare Call Center Should Track
Forward-Looking Metrics: Anticipating Where Your Patients Are Headed
1. Net Promoter Score (NPS): The Loyalty Signal Worth Watching
NPS asks a single question: “How likely are you to recommend our services?” Responses are sorted into promoters (9-10), passives (7-8), and detractors (0-6). Subtract the percentage of detractors from promoters to get your NPS.
Emma, a practice manager in Denver, started reviewing detractor responses carefully and discovered a pattern: patients loved their care team but consistently struggled with the booking process. Addressing the top three booking complaints raised her clinic’s NPS from 23 to 62 in six months.
2. New Patients Scheduled Per Week or Month: Your Growth Barometer
Net new patient volume is one of the clearest indicators of whether your patient access experience is working in your favor. Tracking it consistently lets you correlate changes in your access processes with growth in your patient base.
3. Customer Effort Score (CES): Making Access Easier for Every Patient
Tony is 72 years old and just trying to schedule a follow-up appointment. “I just want it easy,” he says. CES measures exactly that: how much effort your patient had to exert to get their issue resolved. Research shows CES is a strong predictor of loyalty, often more predictive than patient delight alone. Calculate it by asking: “How easy was it to resolve your issue today?” on a 1-to-5 scale, then track patterns over time.
Backward-Looking Metrics: Understanding What Has Already Happened
4. Revenue Growth: Connecting Your Patient Satisfaction to Financial Health
Patient experience and financial performance are more connected than many realize. A widely cited Accenture study found that hospitals delivering superior patient experiences generate 50% higher financial performance than average providers. Your revenue trend lines tell you whether your patient experience investments are working.
5. Unique Patients Per Month: A Clear View of Your Retention Strength
Total unique patients seen each month tells a story about whether your patients are returning and whether your practice is growing. Tracking this alongside acquisition data helps you distinguish between growth from new patients and stability from retained ones.
Operations Metrics: Measuring What Happens Inside the Call
6. First Contact Resolution (FCR): Your Patients Get Answers the First Time
Remember “hot potato” as a kid? In healthcare call centers, patients often feel like the potato, passed from person to person without resolution. FCR measures the percentage of patient inquiries resolved on the first interaction, with no callback, transfer, or escalation required.
FCR is arguably the single most important operational metric for a healthcare call center. High FCR creates a triple win: your patients get answers quickly, your staff feel effective, and your team handles fewer repeat contacts. Aim for at least 80% FCR, with top-performing operations reaching 95% or higher, according to benchmarks from the SQM Group.
7. Time to Resolve: Building Patient Confidence Through Timely Follow-Through
Time to answer and time to resolve are two different things. A call answered in 20 seconds can still result in a three-day resolution process. Tracking your full resolution window helps you find and close the gaps where patients experience friction after the initial contact.
8. Employee Satisfaction: The Foundation Everything Else Rests On
Maria had been answering calls at her healthcare system for seven years. When asked why she stayed, she said simply: “They make me feel like what I do matters.” Your staff are not just the face of your healthcare brand. They are its heart. Gallup research found that healthcare organizations with highly engaged teams outperform peers by 147% in earnings per share. When your staff feel supported, your patients feel it too.
9. Conversion Rate: Turning Patient Calls Into Scheduled Care
Tracking the percentage of new patient calls that convert to a scheduled appointment reveals whether your access process is capturing demand effectively. A low conversion rate often points to friction in scheduling, long hold times, or gaps in agent guidance, all of which you can solve with the right tools and workflows.
10. Quality Scores: Raising the Standard on Every Patient Interaction
Quality scoring should evaluate whether your agents are genuinely helping patients, not just whether they followed a script. Build quality frameworks that capture empathy, accuracy, and problem resolution alongside procedural compliance.
Contact Reaction Metrics: What Your Patients Experience in Real Time
11. Average Speed of Answer: Setting a Strong First Impression
The first 30 seconds of a patient call set the tone for everything that follows. Average speed of answer (ASA) measures how long your patients wait before reaching a live agent or resolution pathway. Consistently fast answer times signal to patients that their time and their health matter to you.
12. Abandonment Rate: Spotting Opportunities to Reach More Patients
Every abandoned call represents a patient who needed something and didn’t get it. Tracking your abandonment rate by time of day, day of week, and call reason helps you identify staffing and workflow opportunities before they compound into retention challenges.
13. Service Level: Delivering on Your Access Promise
Service level measures the percentage of calls answered within a defined threshold (commonly 80% within 30 seconds). Consistent service level performance builds patient trust and reinforces your practice’s reputation for reliable, responsive care.
Efficiency Metrics: Sustaining Quality at Scale
14. Average Handle Time (AHT): Balancing Speed with Genuine Care
Average call duration (Average Handle Time, AHT) measures the total time an agent spends on a call, including post-call work. It is a useful efficiency indicator, but you should always evaluate it alongside quality scores and FCR. The goal is efficient, thorough service, not speed at the expense of resolution.
15. Adherence Rate: Keeping Your Team Ready When Patients Need Them
Schedule adherence measures whether your agents are available when patients need them. Strong adherence supports consistent service levels and ensures your patients always reach someone who can help.
Healthcare Call Center Benchmarks
Knowing which metrics to track is only half the equation. Knowing what good looks like gives your team a clear target. The table below reflects industry-standard benchmarks for healthcare call centers. Use these as a baseline when evaluating your current performance and setting improvement goals.
| Metric Name | Industry Benchmark |
|---|---|
| Net Promoter Score (NPS) | 30–40 (healthcare average; top performers exceed 60) |
| New Patients Scheduled | Track month-over-month trend; growth signals a healthy access process |
| Customer Effort Score (CES) | 4.0 or above on a 1–5 scale |
| First Contact Resolution (FCR) | Above 80%; top-performing operations reach 90–95% |
| Time to Resolve | Same-day resolution for routine requests; under 48 hours for complex cases |
| Employee Satisfaction | 70%+ engagement score; monitor alongside FCR and quality scores |
| Conversion Rate (calls to appointments) | 70–80% for new patient calls |
| Quality Scores | 85%+ on structured evaluation frameworks |
| Average Speed of Answer (ASA) | Under 30 seconds |
| Abandonment Rate | Under 5% |
| Service Level | 80% of calls answered within 30 seconds |
| Average Handle Time (AHT) | Under 4 minutes |
| Adherence Rate | 90% or above |
| Revenue Growth | Track quarterly alongside FCR and NPS improvements |
| Unique Patients Per Month | Track as a retention indicator alongside new patient volume |
Benchmarks are useful reference points, not ceilings. Organizations using integrated workflow tools and real-time guidance consistently outperform these averages across FCR, abandonment, and conversion.
Your Metrics Work When Your Team Knows What to Do With Them
The goal of measurement isn’t better reports. It’s better decisions. Share your metrics with your full team. Celebrate improvements in FCR and NPS. Address spikes in abandonment rate and dips in employee satisfaction before they compound. Your patients have more options than ever, and their access experience is often the deciding factor in whether they return.
To go deeper on each of these metrics, including benchmarks and improvement strategies, download our free 37-page eBook: “The 15 Most Important Patient Experience Metrics“.
Your metrics shouldn’t just sit in a dashboard. They should drive your next move. CareDesk gives your call center team the data, workflow tools, and built-in clinical protocols to act on every one of these 15 metrics in real time, so your patients get answers on the first call and your staff feel confident handling every interaction. See how it works for your team.
Frequently Asked Questions About Patient Experience Metrics in Healthcare Call Centers
What are the most important patient experience metrics for a healthcare call center?
The most impactful metrics fall into five categories: forward-looking indicators like Net Promoter Score (NPS) and Customer Effort Score (CES); backward-looking measures like revenue growth and unique patients per month; operational metrics like First Contact Resolution (FCR) and Time to Resolve; contact reaction metrics like abandonment rate and service level; and efficiency metrics like Average Handle Time (AHT) and schedule adherence. No single metric tells the full story.
How do you measure patient satisfaction in a call center?
Patient satisfaction in a healthcare call center is best measured through a combination of post-call surveys (including NPS and CES), internal quality scoring, and resolution-based metrics like FCR and Time to Resolve. Annual HCAHPS surveys provide useful baseline data but are not sufficient on their own. Real-time or near-real-time feedback loops, paired with operational data, give a much more complete picture of how your patients are actually experiencing your service.
What is First Contact Resolution (FCR) and why does it matter in healthcare?
First Contact Resolution measures the percentage of patient inquiries resolved in a single interaction, without requiring a callback, transfer, or follow-up. In healthcare call centers, high FCR directly reduces patient frustration, lowers repeat call volume, and improves staff efficiency. Top-performing organizations target 80% FCR or higher, with the best consistently reaching 95%, according to benchmarks from the SQM Group.
How does employee satisfaction affect patient experience in a call center?
Highly engaged call center staff deliver measurably better patient experiences. Gallup research found healthcare organizations with highly engaged teams outperform peers by 147% in earnings per share. When your staff feel supported, recognized, and equipped with effective tools, that clarity and confidence translates directly into better patient interactions. Employee satisfaction and patient satisfaction move together.
What is the difference between Average Handle Time and First Contact Resolution?
Average Handle Time (AHT) measures how long an agent spends on a call and post-call work, while First Contact Resolution (FCR) measures whether the patient's issue was fully resolved in that interaction. A short AHT does not guarantee a good patient outcome, because it can indicate rushed calls. FCR is the more patient-centered metric because it measures whether the interaction actually accomplished what your patient needed.
Why do patients abandon calls to medical practices, and how can you reduce it?
Patients typically abandon calls when wait times exceed their patience threshold, which varies by situation. Urgent or anxious callers abandon quickly; routine callers may wait longer. Reducing your abandonment rate requires analyzing when and why patients hang up. Common causes include understaffing during peak hours, inefficient call routing, and lack of self-service alternatives. Tools like AI-assisted scheduling, symptom checking, and intelligent queue management can significantly reduce call abandonment by resolving patient needs faster and more accurately.
How does Customer Effort Score (CES) differ from Net Promoter Score (NPS) in healthcare?
NPS measures overall loyalty ("Would you recommend us?") and is useful for tracking long-term relationship health. CES measures immediate ease of experience ("How easy was it to resolve your issue?") and is more predictive of whether a patient will return after a specific interaction. Both are valuable, but CES is particularly useful for identifying friction points in your access workflows that NPS alone may not surface.
What healthcare call center metrics matter most for patient retention?
The healthcare call center metrics most closely tied to patient retention are First Contact Resolution, Net Promoter Score, abandonment rate, and unique patients per month. Your patients who experience multiple failed call attempts are significantly more likely to seek care elsewhere. Organizations that prioritize FCR improvement consistently see measurable retention gains.